Part 1 – System Architecture and Firmware State Machine
Introduction
18650 lithium ion cells are widely used in portable electronics, IoT devices, and energy storage systems. However, determining the actual capacity and health of a cell is not trivial. Many cells available on the market—especially reclaimed or recycled ones—have significantly degraded performance.
To address this challenge, I designed a scalable 18650 battery capacity tester built around the ESP32 running MicroPython. The goal of the project was to build a reliable, cost effective, and extensible testing platform that can evaluate battery capacity and health while remaining flexible for future improvements.
The system was designed with extensibility in mind. Future upgrades may include:
- Temperature based current control
- Fan speed regulation based on thermal conditions
- LCD interface for real time monitoring and logging
- Power path control to allow the device to operate from a battery during idle phases and low power consumption states (the discharge phase is lengthy but has low power consumption)
- Battery temperature monitoring
- Sending all recorded logs from ESP32 local storage to a web server via Wi-Fi (Wi-Fi is disabled during testing because it affects ADC, DAC, and GPIO functionality)
A key design principle of this project was predictable and safe operation. For this reason, the firmware was implemented as a state machine, where each stage of the testing process is clearly defined.
Firmware Architecture
Battery testing involves multiple stages: validation, charging, resting, discharging, and measurement. Implementing this workflow with a state machine architecture makes the firmware easier to maintain, debug, and extend.
Each state controls:
- Which hardware blocks are active
- Which measurements are taken
- Which conditions trigger a transition to the next state
Title in Other Languages
- German: Wie man einen ESP32 18650 Batterie-Tester baut: Architektur & Logik
- French: Comment construire un testeur de batterie 18650 ESP32 : architecture et logique
- Spanish: Cómo construir un probador de baterías 18650 con ESP32: arquitectura y lógica
- Italian: Come costruire un tester per batterie 18650 con ESP32: architettura e logica
- Portuguese (Brazil): Como construir um testador de bateria 18650 com ESP32: arquitetura e lógica
Tip: Right-click anywhere on this page and choose “Translate to your language”.
Firmware Architecture: State Machine Design
Below, I have added three different state machine diagrams to make the concept easier to understand.
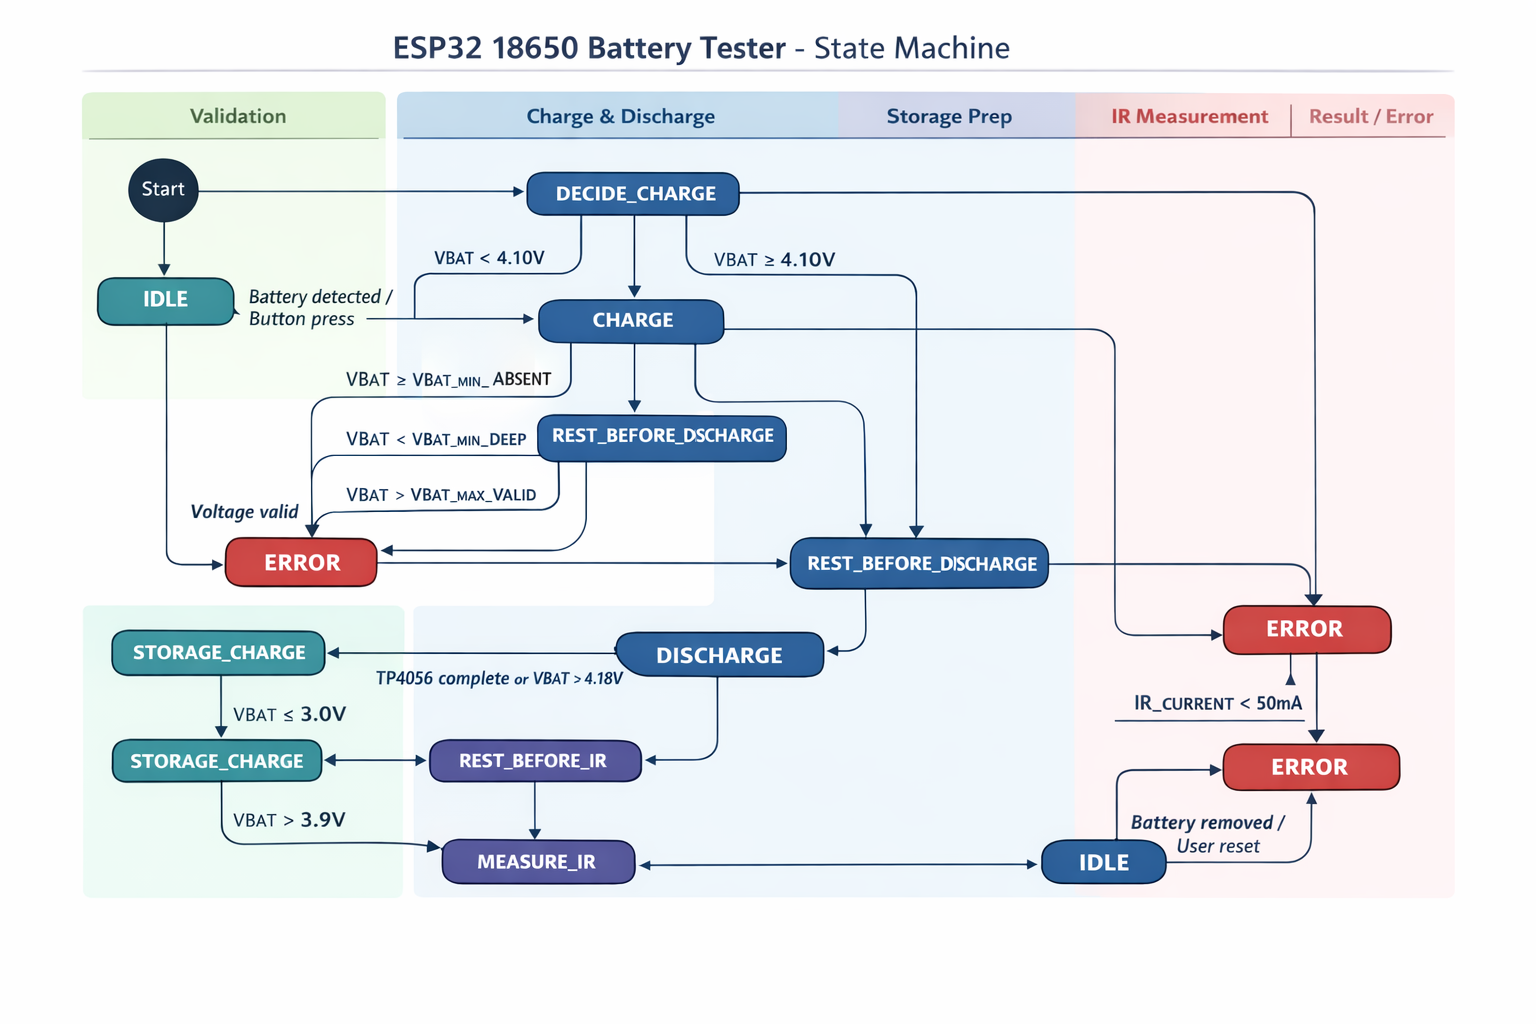
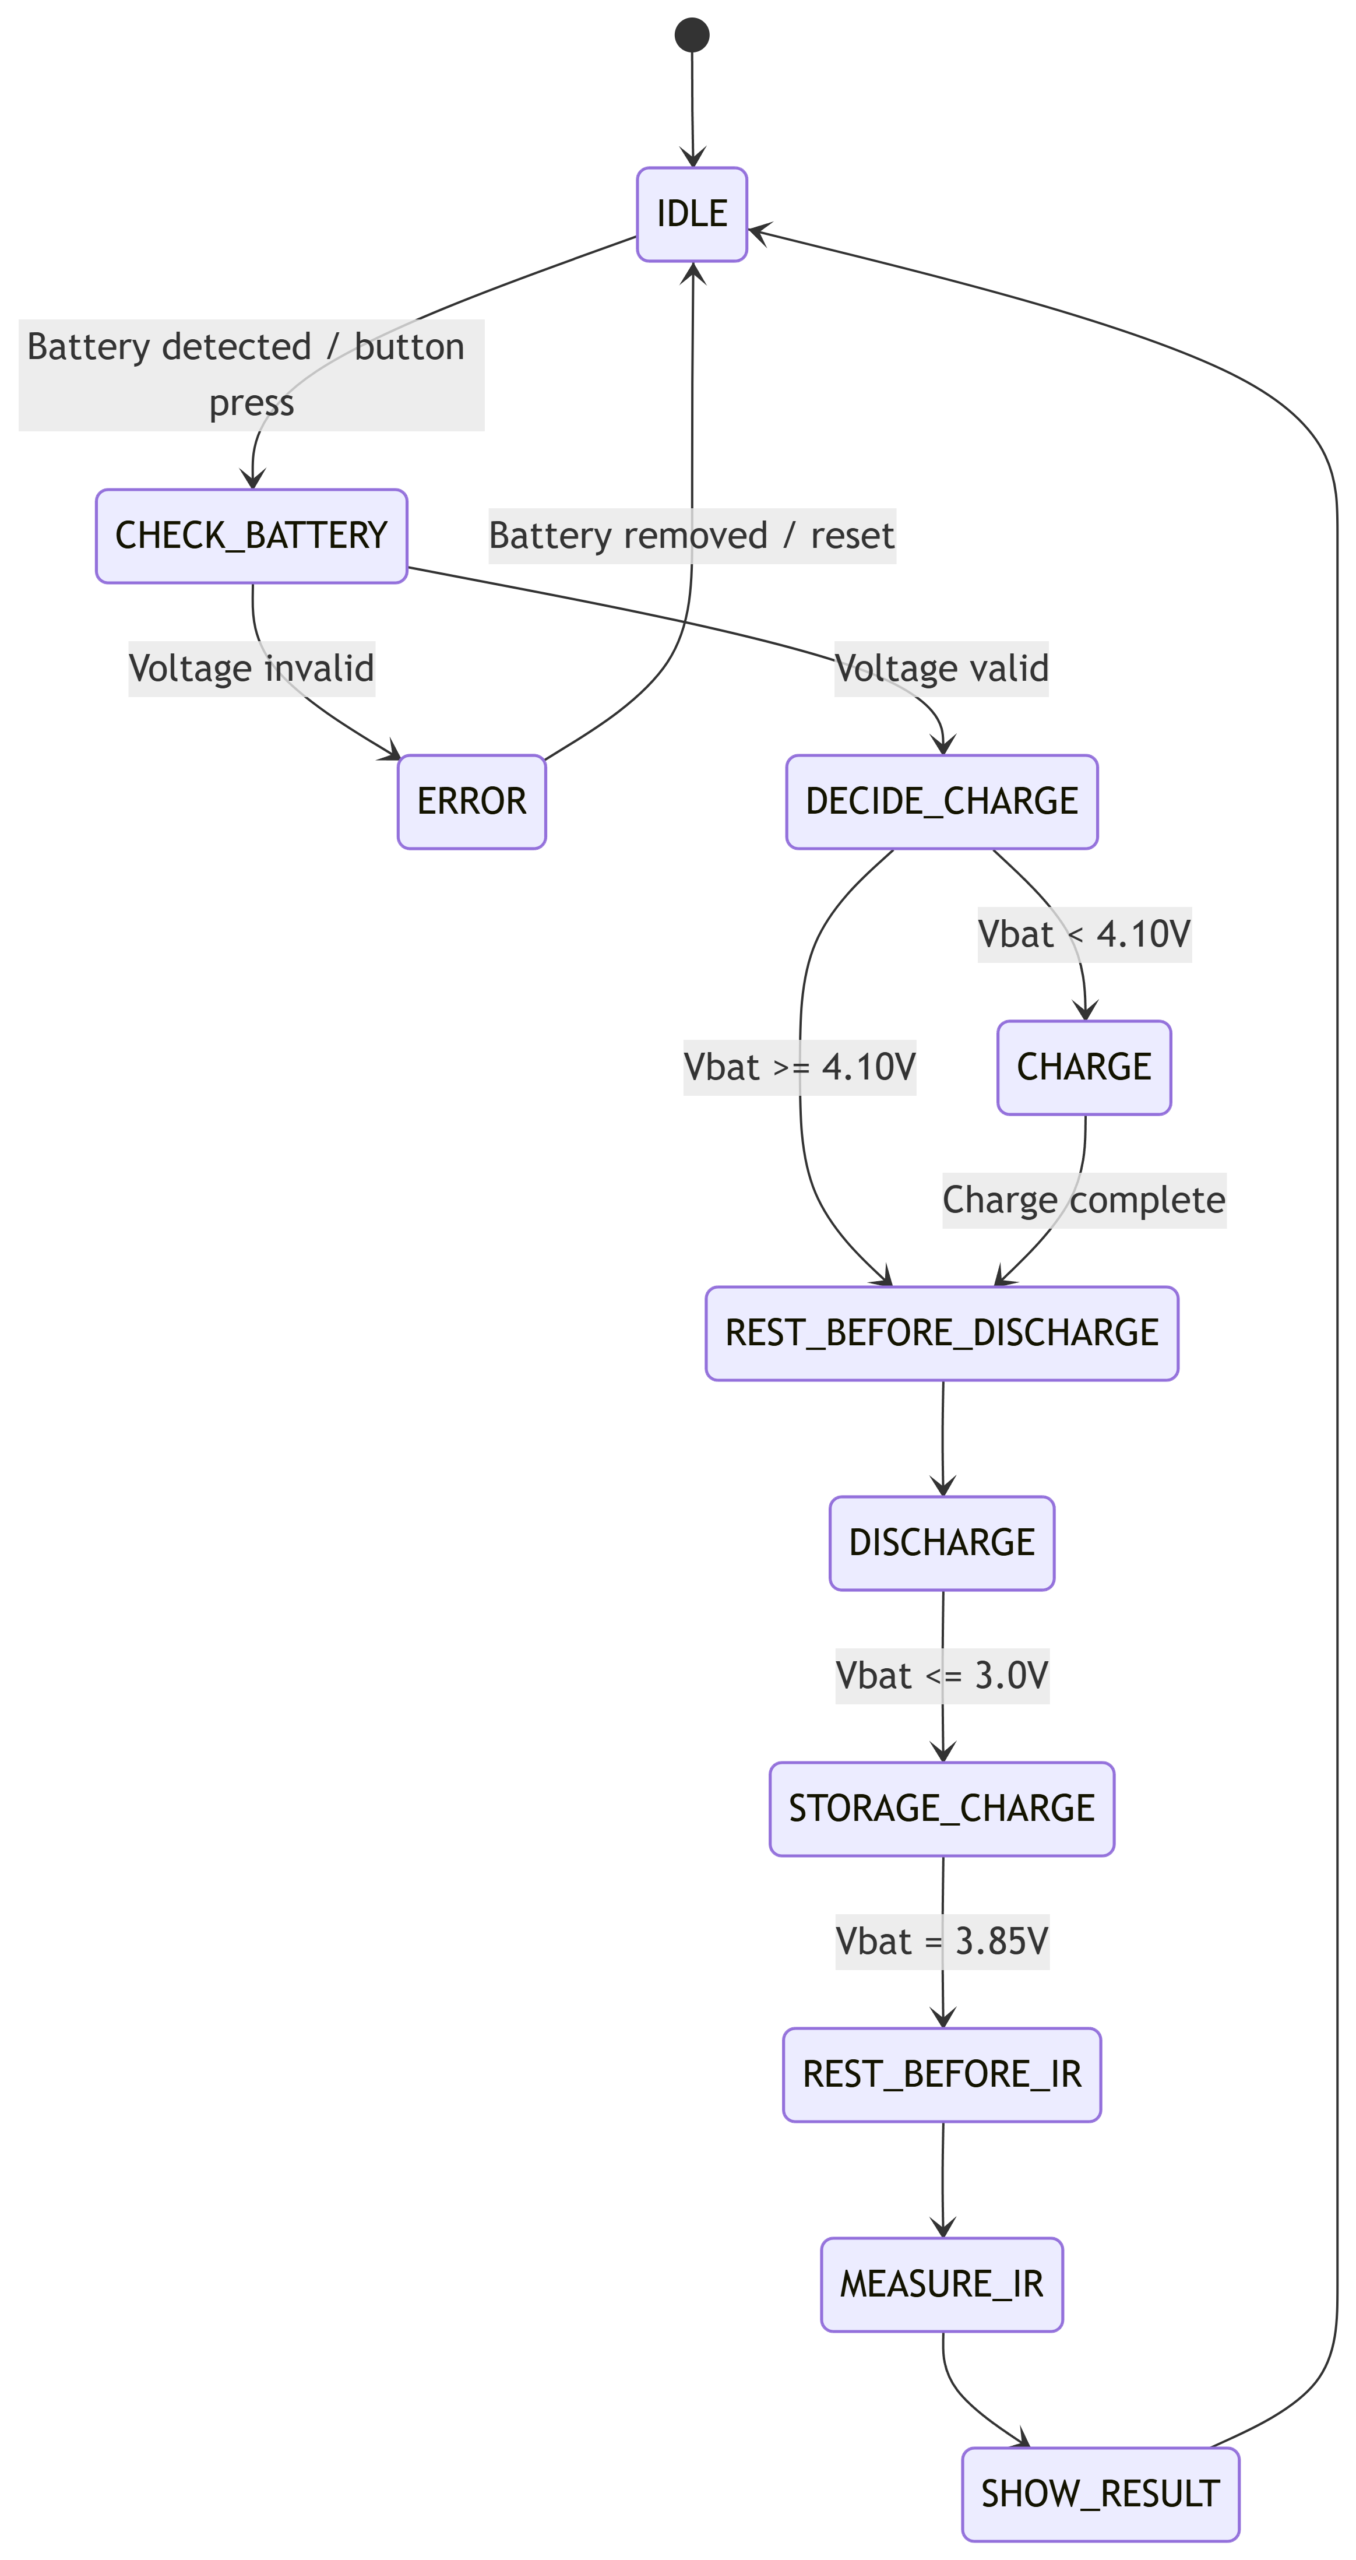
A reliable 18650 battery capacity tester must operate through clearly defined stages. To achieve predictable behavior and simplify debugging, the firmware was implemented as a state machine. Each state represents a specific phase of the test process and defines which hardware components are enabled or disabled.
1. IDLE State
The IDLE state represents the safe standby mode of the device.
The system waits for:
- Battery insertion
- User button press
During this state:
- Disable all power paths
- Status LEDs remain off to indicate that the device is ready
- All outputs are disabled
- Battery, charge, and discharge circuits remain off
This ensures that no current flows unintentionally and the system remains safe while waiting for user interaction.
2. CHECK_BATTERY
Once a battery is detected, the system measures its voltage to determine whether the cell is safe to test.
The following conditions are checked:
- If $Vbat < 1 V$ → invalid battery or connection error
- If $1 V \le Vbat < 2.0 V$ → deep discharge condition (warning or rejection depending on policy)
- If $Vbat > 4.3 V$ → over‑voltage error
If the voltage is within a valid range, the system proceeds to the next stage.
Next state: DECIDE_CHARGE
3. DECIDE_CHARGE
At this stage, the system determines whether the battery must be charged before the discharge test begins.
Logic:
- If $Vbat < 4.10 V$ → the battery must be charged
- Otherwise → proceed directly to stabilization before discharge
Next state: CHARGE or REST_BEFORE_DISCHARGE
4. CHARGE
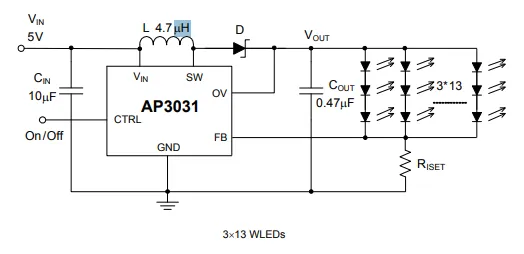
In this phase, the battery is charged using a TP4056 charger module.
Actions performed:
- Disable all power paths
- Enable the battery path
- Enable the charging path
- Periodically measure battery voltage
- Monitor the TP4056 status pins
Charging is considered complete when:
- The TP4056 indicates charge completion, or
- Battery voltage reaches approximately 4.18–4.20 V
The firmware also checks for abnormal conditions:
- Voltage not increasing over time
- Charge timeout
- Unexpected over‑voltage conditions
Next state: REST_BEFORE_DISCHARGE
5. REST_BEFORE_DISCHARGE
Before starting the capacity measurement, the battery is allowed to rest. This phase is important because immediately after charging, the battery voltage is temporarily elevated due to surface charge. A rest period allows the open‑circuit voltage to stabilize.
Actions:
- Disable all power paths
- Record voltage at the start and end of the rest period
Typical rest duration: 5 to 20 minutes
Next state: DISCHARGE
6. DISCHARGE (Capacity Measurement)
This stage performs the actual capacity measurement.
The system:
- Disables all power paths (resetting previous states)
- Enables the battery path
- Enables the discharge path
- Uses the ESP32 DAC output to control the discharge current
- Continuously measures battery voltage, shunt current, and elapsed time
The battery capacity is calculated by integrating current over time:
$$Capacity_{mAh} = \sum I(mA) \times \Delta t(hours)$$
The discharge process stops when:
- Battery voltage reaches 3.0 V
- The target current cannot be maintained
- A fault condition occurs
Next state: FINAL_RECHARGE
7. FINAL_RECHARGE
After the discharge test completes, the battery is recharged again. This step ensures the battery is returned to a usable state after testing.
Important clarification: This step is adjusted based on the battery’s intended use. For storage, the battery should be charged up to 3.9 V, but for immediate use, the battery is charged again to approximately 4.2 V. I chose the storage voltage for my design.
Actions:
- Disable all power paths
- Enable the battery path
- Enable the charging circuit
- Monitor voltage and TP4056 status
Completion occurs when:
- TP4056 indicates full charge, or
- Battery voltage reaches 3.9 V, checked by disabling the charge path every minute
Next state: REST_BEFORE_IR
8. REST_BEFORE_IR
After charging, another stabilization period is required before measuring internal resistance. This ensures that the voltage measurement reflects the true open‑circuit voltage of the battery.
Rest time: 5–20 minutes
Next state: MEASURE_IR
9. MEASURE_IR (Internal Resistance Measurement)
Battery internal resistance provides valuable information about cell health and aging.
The measurement procedure:
- Measure the open‑circuit voltage ($V_{open}$)
- Apply a short load pulse (approximately 0.5 A)
- Wait about 100 ms
- Measure loaded voltage ($V_{load}$) and discharge current ($I_{load}$)
Internal resistance is then calculated as:
$$R_{internal} = \frac{V_{open} – V_{load}}{I_{load}}$$
Optionally, a second longer pulse (e.g., 500 ms) can be used for additional diagnostics.
Next state: SHOW_RESULT
10. SHOW_RESULT
Once all measurements are completed, the device reports the results. Displayed or transmitted data may include:
- Measured capacity
- Total discharge time
- Internal resistance
- Capacity classification
- Internal resistance classification
Next state: IDLE
11. ERROR State
If any abnormal condition occurs during the process, the system enters the ERROR state.
Actions:
- Disable all power paths
- Activate buzzer (if available)
- Display error information
The system waits for a user reset. Afterward, the device returns to IDLE.
✅ In the next article, Mohsen, we can focus on the hardware design challenges during this 18650 battery capacity tester design, including:
- Reverse polarity protection problems
- P‑channel MOSFET body diode conduction
- ESP32 ADC noise and calibration strategies
- The MicroPython DAC initialization error (
ESP_ERR_INVALID_STATE)
Battery Health Check — Resting Voltage After Full Charge
Measure the cell voltage after a full charge, with the charger disconnected and no load attached. Compare the voltage drop over time to estimate battery health.
| Time After Full Charge | Expected Voltage (Healthy Cell) | Interpretation |
|---|---|---|
| Immediately | ≈ 4.20 V | Nominal full-charge surface voltage |
| 5–15 minutes | 4.15 – 4.18 V | Normal small relaxation drop |
| 1 hour | 4.10 – 4.16 V | Excellent cell condition |
| 3–6 hours | ≈ 4.05 – 4.12 V | Typical healthy behavior; slight internal resistance |
| 24 hours | 4.00 – 4.10 V | Good battery; acceptable for most uses |
| 24 hours | < 3.95 V | Sign of aging or higher self-discharge — consider replacing |
| Overnight / next day | Drops rapidly below 3.90 V | Likely internal leakage or failing cell — unsafe for reuse |
Quick rule-of-thumb: a healthy Li-ion cell will typically drop ≤0.10 V after 1–24 hours of resting. Drops >0.20 V within 24 hours indicate degradation or internal leakage.
Recommended Test Procedure
- Charge the battery fully (charger indicates done, ~4.20 V).
- Disconnect the charger and wait 5–15 minutes; record voltage.
- Record voltage again after 1 hour and after 24 hours.
- Calculate ΔV = (voltage immediately after charge) − (voltage at measurement). Use the table above to interpret results.
- If ΔV > 0.20 V within 24 hours, consider capacity test or replacing the cell.
Tip: perform this test at room temperature (20–25 °C). Temperature affects voltage relaxation and can skew results.